WELFARE REFORM IN OKLAHOMA
The 1995 Oklahoma Welfare Reform Act (HB1673) enacted the following changes:
- No cash payments for subsequent births under AFDC, issuing instead infant food and clothing vouchers;
- Conditions continued benefits receipt upon proof of children's immunizations, and minors with children living in adult supervised settings;
- Requires enrollment of children on AFDC in early childhood education programs;
- Grants 24 month extension for transitional Medicaid and child care to recipients upon employment;
- Requires job placement registration with the Employment Securities Commission for unemployed noncustodial parents who owe child support; and
- Mandates school attendance for children kindergarten age through 18; reduces benefits for noncompliance.
A 5-part waiver, which also received approval from the Health and Human Services Administration but has yet to be implemented, would:
- increase a couple's or single parent's hours and income amount allowed before reducing benefits;
- increase the auto equity exemption; and
- implement a 36 month participation time limit.
Under welfare reform, however, states no longer apply for such waivers and must now determine the programmatic/fiscal feasibility of implementing such provisions, given new state options and federal requirements.
AFDC Caseload and Benefit Levels Facts and Statistics
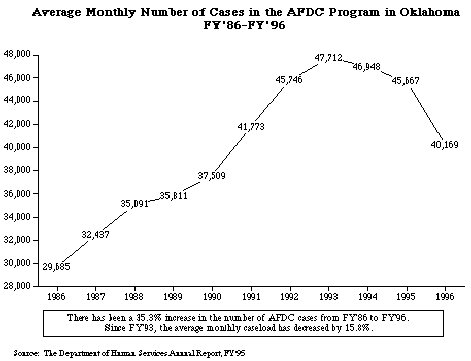
- From 1986 to 1993, Oklahoma's caseloads grew steadily, reaching a peak of 47,712. FY93 to FY95 caseloads decreased 4.3%. Since FY95, caseloads have decreased 12%.
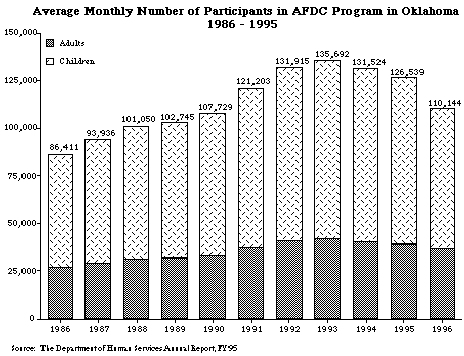
- In spite of fluctuations in the number of participants and cases, the number of children receiving cash assistance remains steady, at about 66% of total participants.
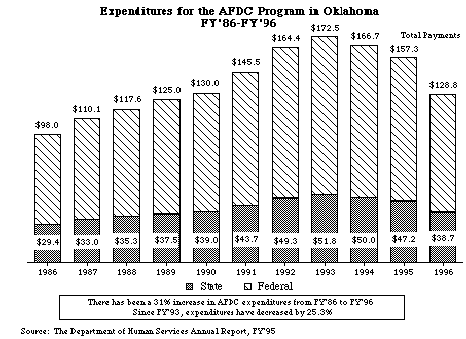
- Caseload expenditures reached a high of $172,517,528 in FY93, but decreased to $128,837,739 in FY96, representing a 25.3% decrease.
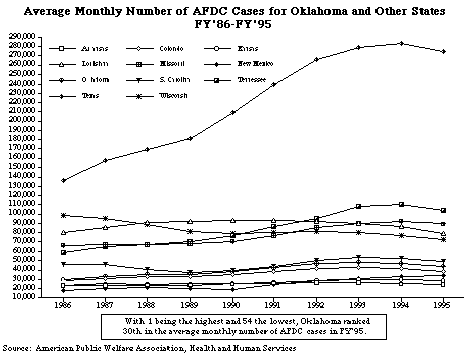
- Of the 8 surrounding regional states, Oklahoma ranks fourth in caseloads. Texas, which ranks the lowest in average monthly benefit levels, ranks highest in caseloads. Kansas ranks second in average monthly benefit levels, but ranks the second lowest in caseloads.
- In FY95, New Mexico ranked highest in average monthly benefit levels at $372.90. Louisiana ranked lowest in average monthly benefit levels at $157.76. Oklahoma ranked fourth with an average monthly benefit level of $282.72.
Comparison of Average Monthly Benefit Levels to Average Monthly Caseloads
State
Avg. Monthly Payment/ Case FY 1995
State
Avg. Monthly Caseload in FY 1995
1. New Mexico
$ 372.901. Texas
274,5052. Kansas
$335.302. Missouri
89,2993. Colorado
$308.623. Louisiana
79,8254. Oklahoma
$282.724. Oklahoma
45,6675. Missouri
$257.165. Colorado
38,5576. Arkansas
$167.376. New Mexico
34,4447. Texas
$157.807. Kansas
28,2328. Louisiana
$157.768. Arkansas
24,296
Comparison of Provisions in the Oklahoma Welfare Reform Bill
and the Federal Welfare Reform Bill
Oklahoma Welfare Reform Bill, HB 1673 (Passed in 1995 Legislative Session)
Federal Temporary Assistance to Needy Families (TANF) Block Grant (Passed August of 1996)
Work Related Sections
Eliminates restriction that couples may only work a total of 100 hours before benefit termination.
Provides a 5 year lifetime limit on benefits; requires recipients to work after 36 months of AFDC participation.
Allows a person to earn up to the need standard before benefits are cut (Fill in the Gap budgeting).
Provides 90 days of case management and transitional support services for recipients who work.
The block grant allows states to set their own eligibility criteria which will include how many (if any) hours a person may work before they lose their benefits. States will now set income standards, asset standards, and benefit levels.
Recipients will be subject to a 5 year lifetime limit. Participants will be required to work after 2 years on assistance.
Social/Health Related Sections
Requires children ages 5 to 18 to attend school or risk losing their monthly benefit.
Requires parents to immunize their children or risk losing their monthly benefit.
Requires parents to enroll their children in a Head Start or other early childhood education program if age appropriate.
Ends additional cash benefits to people having additional children but allows the state to issue vouchers.
Allows states to require children attend school or risk losing their monthly benefit.
Allows states to require immunizations as a condition of eligibility.
Allows states to require early childhood education.
Allows states to deny benefits to additional children and provide vouchers out of funds from the Social Services Block Grant.
Resource Requirements
Increased the vehicle equity exemption from $1,500 to $5,000.
Allows states to set their own resource standards.
Maximum AFDC Payments for a Family of Three in the Surrounding Region for FY95
State
Maximum Payment for a Family of Three
1. Kansas
$4032. New Mexico
$3813. Colorado
$3564. Oklahoma
$3085. Missouri
$2926. Arkansas
$2047. Louisiana
$1908. Texas
$188
Regional Average
$290
Other States
Michigan
$459Wisconsin
$517South Carolina
$200Tennessee
$185 Source: The Department of Human Services Annual Report, FY 1995
Average AFDC Payments for a Family of Three in the Surrounding Region for FY95
State
Maximum Payment for a Family of Three
1. New Mexico
$3902. Kansas
$3353. Colorado
$2984. Oklahoma
$2835. Missouri
$2666. Arkansas
$1787. Louisiana
$1588. Texas
$157
Regional Average
$258
Other States
Michigan
$424Wisconsin
$438South Carolina
$182Tennessee
$177 Source: The Department of Human Services Annual Report, FY 1995
With one being the highest and fifty-four being the lowest, Oklahoma ranks 35th in the Average Monthly Payment paid per case.
Average Monthly Payment Per Case for Oklahoma and Selected States, FY86, FY91, FY 95
State
Average Monthly Payment - Case FY 1986
Average Monthly Payment - Case FY 1991
Average Monthly Payment - Case FY 1995
1. Arkansas
$176.79 $192.28 $167.372. Colorado
$304.89 $322.18 $308.623. Kansas
$325.26 $337.74 $335.304. Louisiana
$167.75 $168.98 $157.765. Michigan
$472.25 $433.47 $413.096. Missouri
$261.31 $271.49 $257.167. New Mexico
$236.34 $298.25 $372.908. Oklahoma
$276.29 $296.29 $282.729. Texas
$171.46 $164.42 $157.8010. Wisconsin
$375.01 $463.81 $448.37
State
Average Monthly Payment - Case FY 1986
State
Average Monthly Payment - Case FY 1991
1. Michigan
$472.251. Wisconsin
$448.372. Wisconsin
$375.012. Michigan
$413.093. Kansas
$325.263. New Mexico
$372.904. Colorado
$304.894. Kansas
$335.305. Oklahoma
$276.295. Colorado
$308.626. Missouri
$261.316. Oklahoma
$282.727. New Mexico
$236.347. Missouri
$257.168. Arkansas
$176.798. Arkansas
$167.379. Texas
$171.469. Texas
$157.8010. Louisiana
$167.7510. Louisiana
$157.76 Source: American Public Welfare Association, Health and Human Services
Percentage of Population Receiving AFDC in the Surrounding Region, FY86 - FY96
State
Pct. of Population Receiving AFDC in June 1986
Pct. of Population Receiving AFDC in June 1986
Pct. of Population Receiving AFDC in June 1986
Percentage Increase/(Decrease) from FY86 to FY96
1. Arkansas
3.0% 3.2% 2.4% (20)%2. Colorado
2.9 3.3 2.9 03. Kansas
2.9 3.2 2.6 (10)4. Louisiana
5.8 6.6 5.4 (7)5. Missouri
4.1 4.6 4.4 76. New Mexico
3.9 5.3 6.6 697. Oklahoma
2.9 3.9 3.1 78. Texas
2.9 4.1 3.8 31
Regional Average
3.6% 4.3% 3.9% 10%
Other States
1. Michigan
7.3% 7.3% 5.5% (24)%2. Wisconsin
6.4 5.0 3.2 (50)3. South Carolina
4.3 3.7 3.3 (23)4. Tennessee
3.5 5.2 4.9 40 Source: The Department of Human Services Annual Reports, FY 1994 and FY 1995
 Oklahoma Senate

