Educational Attainment and Economic Growth
Senate Research StaffNovember 1997
In order for Oklahoma to maximize its economic potential in ensuing years, it must focus on educating its work force and fostering a culture that values completion of college, continuing education, and training throughout each person's life and career.
The relentless speed of technological development, deregulation of long-standing monopolistic industries, and a global playing field will determine the future of national and local economies. Each community's ability to compete successfully in this environment will increasingly depend on human capital factors such as educational attainment of work force, according to Mark Zandi, Chief Economist for Regional Financial Associates.
Craig Knutson, Chief Economist for Southwestern Bell, reiterated this message at a recent meeting of the Citizens' Task Force on Taxation. In the emerging economy, industries capable of generating the most capital will be those that depend on intellectual capacity to add value to raw materials. Mr. Knutson stated that we are shifting from a 'brawn'-based economy of raw materials and labor to a 'brain'-based economy fueled by a highly educated work force.
This presentation continues as a series of charts and explanatory bullets.
Educational Attainment and Economic GrowthTable Of Contents
Education and Income: The National Scene
1. Percent of US Families in Income Ranges, by Educational Attainment
2. Median and Mean Family Incomes, by Educational Attainment
3. Percent of Individuals in Income Ranges, by Educational Attainment
4. Individual Median Incomes, by Educational Attainment
5. Per Capita Personal Income and Percent of College Graduates
Educational Attainment: The Regional Scene
6. Percent of Total Population 25 Years or Older That Earned a High School Diploma
(Details from main chart)
6a. Proportion of Population That Earned a High School Diploma or More, U.S. and OK
6b. Change in Proportion of Population That Earned a High School Diploma or More, 1990 to 1996, U.S. and OK
7. Percent of Total Population 25 Years or Older That Earned a Bachelor's Degree
(Details from main chart)
7a. Proportion of Population That Earned a Bachelor's Degree or More, U.S. and OK
7b. Change in Proportion of Population That Earned a Bachelor's Degree or More, 1990 to 1996, U.S. and OK
Salaries For College Graduates
8. 1993 Average Starting Salaries for College Graduates in Private Industry, by Selected Positions
Science & Technology Degrees
9. Change in Raw Number of Science & Technology Bachelor's Degrees, 1990 to 1994
10. Mix of Bachelor's Degrees, 1990 through 1994
11. Engineering Bachelor's Degrees as a Percent of Total Bachelor's Degrees Conferred
Science & Technology Degrees
12. Projected Growth in Employment, by Level of Education and Training, 1994-2005
Conclusions
1
Education and Income: The National Scene
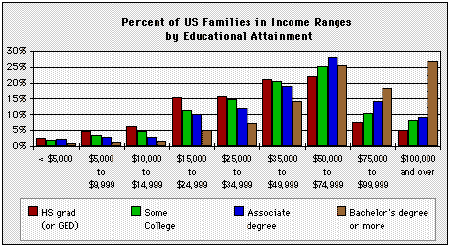
Examining recent Census data further supports the assertion that completion of a higher education program provides otherwise unavailable economic opportunities to families and individuals:
- 70% of college-educated US families earned over $50,000 in 1996, and 27% earned at least $100,000;
- Meanwhile, 35% of families with no more than a high school education (or a GED) earned $50,000, and merely 5% earned over $100,000;
- Taking some college courses, or earning an associate degree each increase family earnings progressively towards college-educated levels.
(Source: USCB, Money Income in the US: 1996)
2
Education and Income: The National Scene
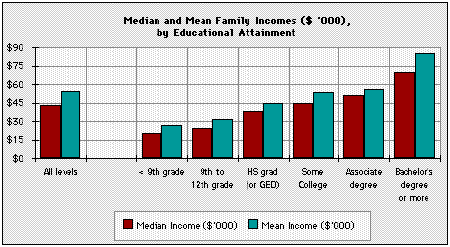
Mean and Median Family Income Data *:
- The 1996 median income for college-educated US families was just under $70,000 (mean income was over $85,000);
- The 1996 median income for high school-educated (or GED) US families was just under $38,600 (mean income was just over $45,000);
- As with income distribution above, some college work and earning an associate degree progressively increase median and mean family incomes towards the levels of college-educated families.
(Source: USCB, Money Income in the US: 1996)
Technical Note:
* Mean income is sensitive to extreme values (especially on the open-ended high side) and is therefore greater than median income. Median income indicates the income level above which half of the observations lie, without further sensitivity to individual magnitudes. The relationship between educational attainment and income may be exagerated by the mean incomes, since they are sensitive to (i.e., "inflated by") even a small number of high incomes.
3
Education and Income: The National Scene
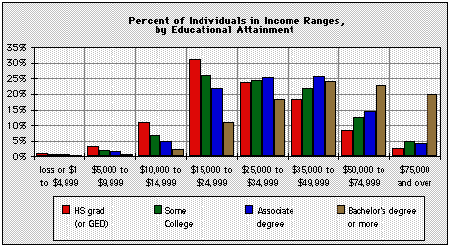
Education and Individual Income:
- 43% of college-educated individuals earned over $50,000 in 1996, and 20% earned at least $75,000 (33% of these individuals earned less than $35,000);
- Meanwhile, 11% of individuals with no more than a high school education (or a GED) earned $50,000, and merely 3% earned over $75,000 (over 70% of these individuals earned less than $35,000);
- Completing some college work, or earning an associate degree both increase income progressively towards levels of college-educated individuals;
- However, the greatest payoff went to individuals that had earned a bachelor's degree.
(Source: USCB, Money Income in the US: 1996)
4
Education and Income: The National Scene
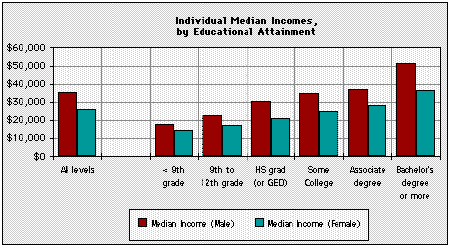
Median Individual Income and Education *:
- The 1996 median income for college-educated men (bachelor's degree) was over $50,000 (i.e., half of college-educated men earned over $50,000);
- The 1996 median income for college-educated women was over $36,000 (i.e., half of college-educated women earned over $36,000);
- A college education is generally associated with substantially higher median incomes for both men and women.
(Source: USCB, Money Income in the US: 1996)
Footnote:
* USCB reports median incomes separately for men and women; the detailed information necessary to calculate a combined median income for both sexes is not available. Age of population may partly explain the income differential between men and women; women in this sample were younger than the men (67% of women sampled were less than 45 years old, versus 59% for men), and possibly at earlier career stages.
5
Education and Income: The National Scene

In today's economy, income and educational attainment are strongly related, and increasingly so.
- 13 states are in the top 3rd for both PCPI, and Percent of College Educated Population (bachelor's degree conferred);
- 12 states (including Oklahoma) are in the bottom 3rd for both PCPI, and Percent of College Educated Population;
- 2 states (NV and PA) are in the top 3rd for PCPI while also in the bottom 3rd for Percent of College Educated population.
(Source: BEA, revised GSP and PI estimates; USCB, taxes, educational attainment, and population data)
6
Educational Attainment: The Regional Scene
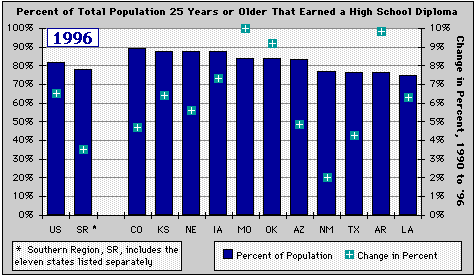
Oklahoma has made remarkable progress in increasing its number of high school graduates among people 25 years or older. In 1990, Oklahoma ranked 36th in the country for percent of population with at least a high school diploma (or GED). By 1996, Oklahoma had risen in the state ranking to 26th, with the 8th highest increase in the nation.
- Oklahoma, Missouri, and Arizona are essentially tied with the fifth highest percent of high school graduates (or GEDs) among the eleven regional comparison states (around 84%);
- Oklahoma's percent of high school graduates (83.8%) is above both national and regional averages (81.8% and 78.2%, respectively);
- Oklahoma increased its proportion of high school graduates between 1990 and 1996 by 9.2 percentage points (3rd highest increase of eleven regional comparison states);
- This is well above both the national and regional increases of 6.5 and 3.5 percentage points, respectively;
- By 1996, Oklahoma's proportion of high school graduates exceeded the national proportion by over 42,700 people;
- Oklahoma appears to be performing well with respect to high school graduation.
(Source: USCB, 1990 Census Data; USCB, Current Population Reports [P20-493])
6a
Educational Attainment: The Regional Scene
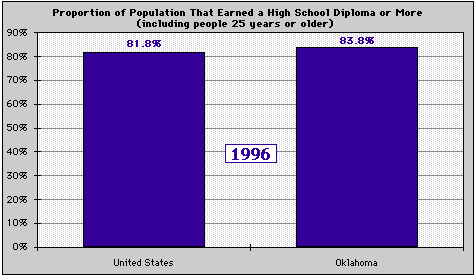
Oklahoma has made remarkable progress in increasing its number of high school graduates among people 25 years or older. In 1990, Oklahoma ranked 36th in the country for percent of population with at least a high school diploma (or GED). By 1996, Oklahoma had risen in the state ranking to 26th, with the 8th highest increase in the nation.
- Oklahoma, Missouri, and Arizona are essentially tied with the fifth highest percent of high school graduates (or GEDs) among the eleven regional comparison states (around 84%);
- Oklahoma's percent of high school graduates (83.8%) is above both national and regional averages (81.8% and 78.2%, respectively);
- Oklahoma increased its proportion of high school graduates between 1990 and 1996 by 9.2 percentage points (3rd highest increase of eleven regional comparison states);
- This is well above both the national and regional increases of 6.5 and 3.5 percentage points, respectively;
- By 1996, Oklahoma's proportion of high school graduates exceeded the national proportion by over 42,700 people;
- Oklahoma appears to be performing well with respect to high school graduation.
(Source: USCB, 1990 Census Data; USCB, Current Population Reports [P20-493])
6b
Educational Attainment: The Regional Scene

Oklahoma has made remarkable progress in increasing its number of high school graduates among people 25 years or older. In 1990, Oklahoma ranked 36th in the country for percent of population with at least a high school diploma (or GED). By 1996, Oklahoma had risen in the state ranking to 26th, with the 8th highest increase in the nation.
- Oklahoma, Missouri, and Arizona are essentially tied with the fifth highest percent of high school graduates (or GEDs) among the eleven regional comparison states (around 84%);
- Oklahoma's percent of high school graduates (83.8%) is above both national and regional averages (81.8% and 78.2%, respectively);
- Oklahoma increased its proportion of high school graduates between 1990 and 1996 by 9.2 percentage points (3rd highest increase of eleven regional comparison states);
- This is well above both the national and regional increases of 6.5 and 3.5 percentage points, respectively;
- By 1996, Oklahoma's proportion of high school graduates exceeded the national proportion by over 42,700 people;
- Oklahoma appears to be performing well with respect to high school graduation.
(Source: USCB, 1990 Census Data; USCB, Current Population Reports [P20-493])
7
Educational Attainment: The Regional Scene
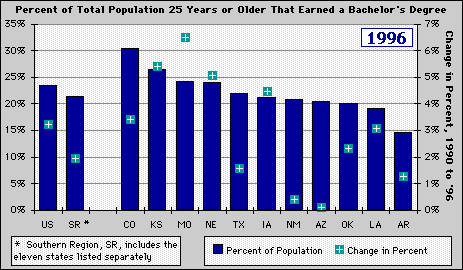
However, despite this increase in high school graduates, the analogous increase in the percent of people with at least a bachelor's degree was a mere 2.3 percentage points, which ranked 35th in the country. While Oklahomans increasingly appreciate the need for a high school diploma, pursuit of a college education remains underrated.
- Among eleven regional comparison states, Oklahoma has the third lowest percent of college graduates (although New Mexico, Arizona and Louisiana are all within 1 percentage point of Oklahoma);
- The percent of college graduates in Oklahoma (20.1%) is below both national and regional averages (23.6% and 21.3%, respectively) and ranks 39th in the country;
- An additional 72,300 Oklahomans 25 years or older needed to earn a bachelor's degree for Oklahoma to match the 1996 proportion of college graduates;
- Oklahoma increased its proportion of college graduates between 1990 and 1996 by 2.3 percentage points (7th highest increase of eleven regional comparison states);
- This is below the national increase of 3.2 percentage points, but above the regional increase of 1.9 percentage points;
- Despite gaining ground on high school graduates, Oklahoma is not gaining any ground on neighboring states with respect to completion of 4-year college programs, and is actually loosing ground on the nation, overall.
(Source: USCB, 1990 Census Data; USCB, Current Population Reports [P20-493])
7a
Educational Attainment: The Regional Scene
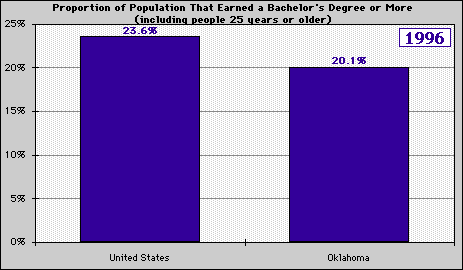
However, despite this increase in high school graduates, the analogous increase in the percent of people with at least a bachelor's degree was a mere 2.3 percentage points, which ranked 35th in the country. While Oklahomans increasingly appreciate the need for a high school diploma, pursuit of a college education remains underrated.
- Among eleven regional comparison states, Oklahoma has the third lowest percent of college graduates (although New Mexico, Arizona and Louisiana are all within 1 percentage point of Oklahoma);
- The percent of college graduates in Oklahoma (20.1%) is below both national and regional averages (23.6% and 21.3%, respectively) and ranks 39th in the country;
- An additional 72,300 Oklahomans 25 years or older needed to earn a bachelor's degree for Oklahoma to match the 1996 proportion of college graduates;
- Oklahoma increased its proportion of college graduates between 1990 and 1996 by 2.3 percentage points (7th highest increase of eleven regional comparison states);
- This is below the national increase of 3.2 percentage points, but above the regional increase of 1.9 percentage points;
- Despite gaining ground on high school graduates, Oklahoma is not gaining any ground on neighboring states with respect to completion of 4-year college programs, and is actually loosing ground on the nation, overall.
(Source: USCB, 1990 Census Data; USCB, Current Population Reports [P20-493])
7b
Educational Attainment: The Regional Scene
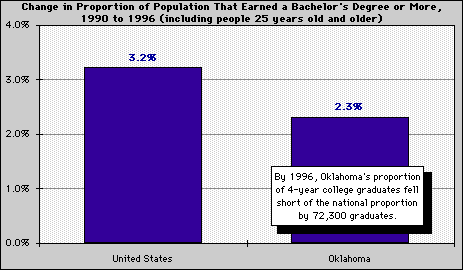
However, despite this increase in high school graduates, the analogous increase in the percent of people with at least a bachelor's degree was a mere 2.3 percentage points, which ranked 35th in the country. While Oklahomans increasingly appreciate the need for a high school diploma, pursuit of a college education remains underrated.
- Among eleven regional comparison states, Oklahoma has the third lowest percent of college graduates (although New Mexico, Arizona and Louisiana are all within 1 percentage point of Oklahoma);
- The percent of college graduates in Oklahoma (20.1%) is below both national and regional averages (23.6% and 21.3%, respectively) and ranks 39th in the country;
- An additional 72,300 Oklahomans 25 years or older needed to earn a bachelor's degree for Oklahoma to match the 1996 proportion of college graduates;
- Oklahoma increased its proportion of college graduates between 1990 and 1996 by 2.3 percentage points (7th highest increase of eleven regional comparison states);
- This is below the national increase of 3.2 percentage points, but above the regional increase of 1.9 percentage points;
- Despite gaining ground on high school graduates, Oklahoma is not gaining any ground on neighboring states with respect to completion of 4-year college programs, and is actually loosing ground on the nation, overall.
(Source: USCB, 1990 Census Data; USCB, Current Population Reports [P20-493])
8
Salaries For College Graduates
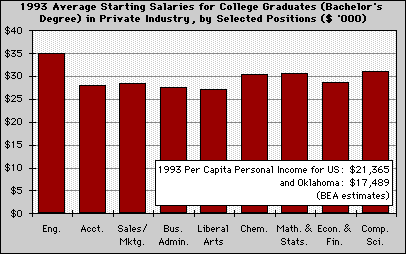
Salaries are closely tied to educational attainment. The Bureau of Labor Statistics recently released employment projections through 2005 which indicate that 85% of jobs with the highest earnings (top quartile earnings) will require at least an associate degree.
- In 1993, a U.S. Census Bureau survey of 200 corporations revealed average salaries that those corporations planned to offer new college graduates;
- Starting salaries for engineering positions averaged $35,000;
- Starting salaries for chemistry, mathematics, statistics, and computer science positions all averaged above $30,000;
- All starting positions for college graduates averaged over $25,000.
(Source: USCB, 1996 Statistical Abstract of the United States)
9
Science & Technology Degrees
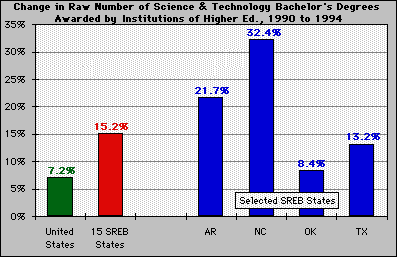
Oklahoma is apparently losing ground on states in the southern region with respect to the number of bachelor's degrees being conferred in fields of science & technology:
- Oklahoma's raw number of bachelor's degrees conferred in fields of science & technology increased by 8.4% between 1989-90 and 1993-94 (the 12th highest increase among the fifteen SREB comparison states *);
- The analogous raw figures for neighboring states increased over the same period by as much as 33% (South Carolina);
- During this time period, South Carolina surpassed Oklahoma in raw number of science & technology degrees conferred;
- The overall increase in raw number of science & technology degrees for the fifteen SREB comparison states was 15.2%;
(Source: Southern Regional Education Board, SREB Fact Book on Higher Education 1996/1997)
Footnote:
* SREB States comprise Alabama, Arkansas, Florida, Georgia, Kentucky, Louisiana, Maryland, Mississippi, North Carolina, Oklahoma, South Carolina, Tennessee, Texas, Virginia, and West Virginia
10
Science & Technology Degrees
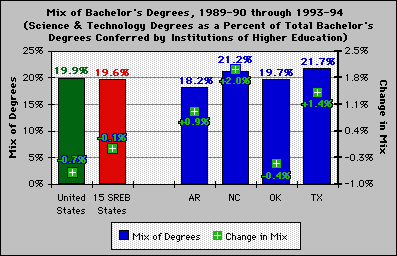
While the raw number of science & technology degrees conferred by Oklahoma institutions of higher education has increased, the mix of degrees conferred has shifted away from science & technology fields:
- 19.7% of bachelor's degrees that Oklahoma institutions of higher education conferred during the 1993-94 academic year were in areas of science & technology;
- This was comparable to the national and regional percentages of 19.9% and 19.6%, respectively;
- The mix of bachelor's degrees conferred by Oklahoma institutions of higher education has shifted away from science & technology, slightly, since 1990 (percent of total bachelor's conferred that were in a science & technology field dropped 0.4 percentage points from 20.1% in 1989-90 to 19.7% in 1993-94);
- This shift away from science & technology was slightly more pronounced on a national level (-0.7 percentage points) and negligible on a regional level (-0.1 percentage points);
(Source: Southern Regional Education Board, SREB Fact Book on Higher Education 1996/1997)
Footnote:
* SREB States comprise Alabama, Arkansas, Florida, Georgia, Kentucky, Louisiana, Maryland, Mississippi, North Carolina, Oklahoma, South Carolina, Tennessee, Texas, Virginia, and West Virginia
11
Science & Technology Degrees
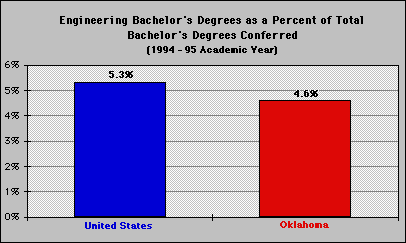
Oklahoma institutions of higher education are producing a smaller proportion of graduates in engineering fields, compared to the national mix of bachelor's degrees conferred:
- 4.6% of bachelor's degrees conferred by Oklahoma institutions of higher education were in an engineering field (total of 14,789 degrees conferred, 1994-95 academic year);
- The analogous national proportion is 5.3% (total of 1.17 million degrees conferred, 1994-95 academic year);
- Oklahoma institutions fell 107 degrees short of the national proportion;
(Sources: NCES, Digest of Education Statistics 1996; OSRHE , Degrees Conferred in Oklahoma Higher Education)
12
Employment Outlook
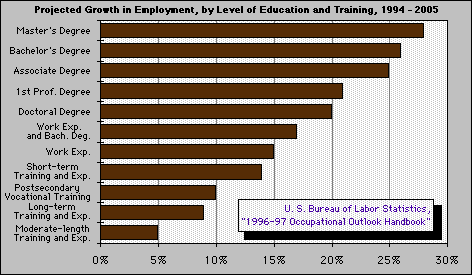
Education will play an increasingly large part in eligibility for available jobs:
- Occupations which require a bachelor's degree or above will average 23% growth, almost double the 12% growth expected for occupations that require less education and training;
- Jobs with above average wages are expected to account for 60% of employment growth. Such jobs require higher levels of education and training.
The following six top job growth fields are all health care or technology-related. They show growth potential into the twenty-first century:
- Biotechnology - Science, biology, engineering, and chemistry backgrounds will provide for unlimited opportunities in this field;
- Computer Graphics - Computer-aided design (CAD) and computer-aided imagery will be two of the fastest growing fields;
- Health Care - Technological improvements will create treatment breakthroughs;
- Lasers - From health care to communications to manufacturing, lasers will be used in a variety of ways;
- Robotics - Projections of a new generation of robots will increase demand for engineers, technicians, installers, and repair personnel.
(Source: BLS, 1996-97 Occupational Outlook Handbook; Hello! America, Inc. The 100 Best Jobs for the 1990s and Beyond; and Silver, A. David, "Quantum Companies: 100 Companies That Will Change the Face of Tomorrow's Business", 1995)
13
Conclusions
Educational attainment is strongly linked to high income levels. Unfortunately, Oklahoma does not fare well in college attainment levels, a key component of generating better incomes.
Oklahoma has fewer college graduates per capita than the national average and most surrounding states. More importantly, we are falling further behind, especially in key fields of science and technology. This trend must be reversed to put Oklahoma into a competitive position in today's knowledge-based economy.
Oklahoma must generate more college graduates to enrich its labor force and make itself attractive to high-wage information companies. We can do this by:
- Providing grade 13 and 14 scholarships for all students completing rigorous high school course work;
- Retraining existing work force in science, technology, and information systems fields, allowing them to move into higher paying jobs;
- Increasing investment in computer technology and Internet access in public schools to foster a corps of computer literate students.
 Oklahoma Senate

