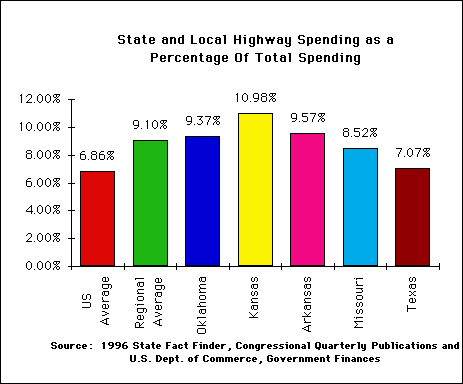
- State and local government in Oklahoma spends 36% more of its budget on highways than the national average;
- State and local government in Oklahoma spends 3% more of its budget on highways than the regional average;
- 9.37% of state and local government spending in Oklahoma goes to highways. Nationally, only 6.86% percent of spending is devoted to highways;
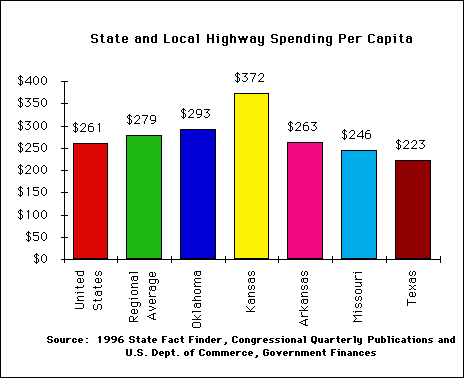
- Oklahomans contribute 12% more tax dollars per capita to building and maintaining our highways than does the average American;
- Oklahomans contribute 5% more tax dollars per capita to building and maintaining highways than the regional average;
- Oklahomans spend $293 per capita on highways each year. Nationally, Americans spend $261 per capita on highways.


State and Local Highway Spending Per Capita
Rank*
Regional Average 29 Oklahoma 23 Kansas 12 Arkansas 32 Missouri 37 Texas 43Source: 1996 State Fact Finder, Congressional Quarterly Publications and
U.S. Dept. of Commerce, Government Finances
Rank*: 1=Highest, 50=Lowest
State and Local Highway Spending as a Percentage of Total Spending
Rank*
Regional Average 18 Kansas 7 Arkansas 13 Oklahoma 15 Missouri 20 Texas 36Source: 1996 State Fact Finder, Congressional Quarterly Publications and
U.S. Dept. of Commerce, Government Finances
Rank*: 1=Highest, 50=Lowest
Note: Western states tend to have relatively higher rates of spending on highways because of their larger geographic size. Mountain states often have increased road costs due to the expense of construction and maintenance in difficult terrain. Many western states are also more sparsely populated tending to drive up costs on a per capita basis.
 Oklahoma Senate

